The Art of Logging
2023年2月28日 · 2677 字
Understanding logs isn't easy. Developers often struggle with whether a log statement is meaningful, SREs are at a loss when production issues lack logs, Ops spend extra effort managing massive logs, and project managers don't want to invest too much in logs that don't add business value.
Therefore, following best practices when developing applications and using mature solutions for log collection and management can alleviate these conflicts, which is the focus of this article.
The Beginning of the Conflict
First, let's discuss why we need to log and the purpose of logs. Most developers have a clear understanding and strong need for logs when debugging code and solving bugs in different environments. Logs are the assistant for debugging and the savior in production environments. I've only seen complaints about too few logs, rarely about too many. Logs help determine code paths, check if APIs are requested correctly, verify core business data, and identify error stack traces. It's hard to imagine troubleshooting bugs in a complex system without any logs.
If there's such a strong need, why not log every line of code to capture the context? In theory, this is feasible, but there are issues. First, storage: common medium to large systems generate logs in the TB range, and super-large systems in the PB range. According to Cloudflare's data, they handle about 40 million requests per second, posing a huge storage cost. Second, search performance: solutions like Elasticsearch struggle with massive logs, even with different indexes and distributed clusters. Third, generating massive logs during peak times can slow down the system and increase failure risks.
So, the simplest conclusion is that logs shouldn't be too many to make storage and management difficult, nor too few to hinder troubleshooting. This paradox is the art of logging!
Log Levels
Before logging, we need to determine the log level. Log levels help prioritize log information, reduce noise, and prevent alert fatigue. They also aid in filtering logs during searches.
Common log levels, from low to high, are: TRACE, DEBUG, INFO, WARN, ERROR, FATAL. In local environments, we usually set the log level to Trace to print all logs. In production, due to storage pressure, search performance, and disk IO impact, we adjust the log level to INFO or even ERROR. This means logs below this level won't be printed.
Does this mean we only need to log at the production level? For example, if production only logs INFO, should we skip DEBUG logs? Some project managers, to save on log management costs, only log ERROR in production. Should we skip INFO logs then? While this is common, reality is more complex, as shown in the following scenarios.
Scenario One
An engineer investigating low performance of a resource creation API in production found that logging INFO level logs with resource objects before saving them caused memory buffer exhaustion during peak times, slowing down the main thread and overall service performance. The engineer removed the log to reduce disk IO and solve the performance issue.
However, a later code change in the API service chain caused errors in created objects. Without the resource-saving logs, it was hard to determine if the issue was with the API request parameters or subsequent logic. Should we modify the log level and redeploy?
Scenario Two
If production logs are set to ERROR, a downstream service failure causing timeouts during peak QPS can generate massive error logs, increasing disk IO and CPU usage, leading to service crashes. How should we handle this?
Scenario Three
An engineer troubleshooting a production issue found that INFO logs were insufficient and needed a DEBUG log, but production only had INFO logs. Should we change the log level and restart the service?
Log Level Standards and Dynamic Adjustment
To solve these issues, we need clear log level standards in projects and dynamic log level adjustment. Lowering the log level in production to get comprehensive debug logs can help engineers locate issues efficiently. Raising the log level during log surges can reduce log generation, ease disk IO pressure, and improve service performance.
Here are some log level suggestions:
- TRACE: Use during development to trace errors, but never commit to version control.
- DEBUG: Log everything happening in the program. Use mainly during debugging, and reduce debug statements before production, leaving only the most meaningful entries, which can be activated during troubleshooting.
- INFO: Log all user-driven events or system-specific operations (e.g., scheduled tasks).
- WARN: Log potential errors, like a database call taking too long or a memory cache nearing capacity. This allows for appropriate alerts and better understanding of system behavior before failures.
- ERROR: Log every error condition, like API calls returning errors or internal errors.
- FATAL: Indicates the entire service is down. Use sparingly, usually indicating program termination.
Logging
When to Log
There's no standard for when to log; developers must judge based on business and code. Besides regular event logging (e.g., operations performed, unexpected situations, unhandled exceptions or warnings, scheduled tasks), I suggest logging in the following scenarios:
- When calling third-party systems, log the API URL,
Request/Response Body, and exceptions. This provides clear logs to identify issues, reducing disputes between different system operators or companies and facilitating problem resolution. - Log key code and branches in important core business, like if-then-else statements, to help developers understand if the program followed the expected path. Core business data is often hard to reproduce manually, so understanding code paths is crucial.
- Audit logs for core business, especially if related to legal or contractual matters. Store logs in a strongly consistent database.
- Log configuration information when the application starts. Initialization logic usually runs once and is hard to reproduce during diagnosis, so it should be logged.
Log Attributes
Besides the usual log level, timestamp, message, exception, and stack trace, other fields can help locate and identify root causes. Common extra fields include:
trace id: A unique ID for service link tracking. Add it to the HTTP header at the system's 7-layer gateway and carry it throughout the request. When the request chain is long,trace idhelps find complete logs.span id: Represents a single operation in thetrace idlifecycle. Each service generates aspan idfor the request, with the first being the root span. The upstreamspan idis recorded aspspanid(parent-spanid). The current service'sspan idis passed downstream aspspanid. This helps reconstruct the request chain when service calls are complex.user id: A unique user ID. When users report issues or submit tickets, this helps directly query error logs, reducing interference and shortening troubleshooting time.tenant_id: The tenant ID (if applicable). Useful for multi-tenant systems.request uri: The current microservice request URI. When a business issue arises, therequest urioften quickly provides thetrace id, which helps find the corresponding request logs.application name: The current microservice name. Helps identify which service generated the log and filter logs byapplication nameto query overall service failures.pod name: The k8s resource Pod name (if applicable). Most microservices use k8s for container orchestration. Loggingpod namehelps restart or kill a faulty Pod.host name: The machine name of the current request. Even with k8s-managed microservices, hardware issues like disk or network failures can cause service issues. Logginghost namehelps troubleshoot the final mile of hardware-related failures.
Log Security
Logs must ensure the security of the logging framework and handle sensitive information. Use mature, production-validated logging libraries, not custom solutions. Sensitive information handling is crucial for most companies. Remember these security and compliance requirements:
- Do not leak sensitive personal identity information (PII).
- Do not leak encryption keys or secrets.
- Ensure the company's privacy policy covers log data.
- Ensure log providers meet compliance requirements.
- Ensure data storage duration requirements are met.
Bad Logging Practices
- Using non-English logs.
- English logs are recorded in ASCII characters, which is important as non-English characters may not display correctly after processing.
- English has built-in word segmentation, making it easier to store and query logs in engines like
ElasticSearch. Non-English logs require special tokenizers and have less effective storage and query results.
- Logs without context, like
Transaction failedorUser operation succeeds. These messages may be understandable in code context but not in the log itself. - Logging in loops. Unless necessary, loop logs are hard to read and consume storage.
- Referencing slow operation data. If logging requires remote service calls, database queries, or heavy computation, consider if the information is necessary and appropriate.
Log Observability
In the last decade, the rise of microservices and cloud-native has significantly changed log collection, storage, and analysis. Early on, we didn't need log collection, storing all monolithic service logs in files and using tail, grep, and awk to extract information. But with increasing system complexity, this approach no longer suffices. To meet growing log management needs, the open-source community and industry have developed solutions like the popular Elastic Stack, and cloud providers offer one-stop solutions like AWS DataDog and Azure Dynatrace.
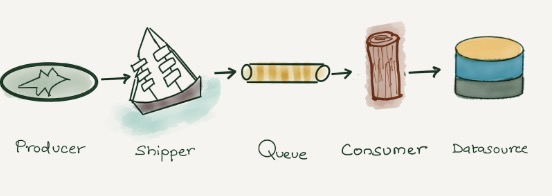
Regardless of the solution, log management is no longer simple. Between logging and querying logs, there are steps like collection, buffering, aggregation, processing, indexing, and storage, each with its challenges.

Log Collection
Initially, we used Logstash from the Elastic Stack for log collection and processing. Different services in the system sent logs to Logstash via tcp/udp, which then transformed and output the logs. This method lasted a long time but had significant drawbacks. Logstash and its plugins, written in JRuby, ran on a separate Java virtual machine process with a default heap size of 1GB. Deploying thousands of log collectors made this approach too heavy. Later, Elastic.co rewrote a lighter, more efficient log collector Filebeat in Golang, alleviating this issue.
Additionally, Fluentd is the preferred open-source log collector for Kubernetes. It's Kubernetes-native and can be deployed as a DaemonSet for seamless integration. It collects logs from various sources like Kubernetes clusters, MySQL, and Apache2, and sends them to destinations like Elasticsearch and Amazon S3. Fluentd, written in Ruby, performs well at low volumes but faces performance issues with increased nodes and applications.
During log collection, business peaks can generate massive logs, affecting service stability and causing log loss. In such cases, we need a buffer layer before Logstash or the log storage database. For smaller systems, Redis streams is a good choice. For larger data scales, Kafka clusters or cloud provider message queue solutions are ideal.
Structured Logs
After collecting logs, we need to structure them. Logs are unstructured data, often containing multiple pieces of information in one line. Without processing, we can only use raw full-text search, which isn't conducive to statistics, comparison, or filtering. For example, this is an Nginx server access log:
10.209.21.28 - - [04/Mar/2023:18:12:11 +0800] "GET /index.html HTTP/1.1" 200 1314 "https://guangzhengli.com" Mozilla/5.0 (Macintosh; Intel Mac OS X 10_15_7) AppleWebKit/537.36 (KHTML, like Gecko) Chrome/110.0.0.0 Safari/537.36
Despite being familiar with the default Nginx format, the above example is still hard to read and process. We can use Logstash or other tools to convert it into structured data, like JSON:
{
  "RemoteIp": "10.209.21.28",
  "RemoteUser": null,
  "Datetime": "04/Mar/2023:10:49:21 +0800",
  "Method": "GET",
  "URL": "/index.html",
  "Protocol": "HTTP/1.1",
  "Status": 200,
  "Size": 1314,
  "Refer": "https://guangzhengli.com",
  "Agent": "Mozilla/5.0 (Macintosh; Intel Mac OS X 10_15_7) AppleWebKit/537.36 (KHTML, like Gecko) Chrome/110.0.0.0 Safari/537.36"
}
After structuring, databases like ElasticSearch can index different data items for query, statistics, and aggregation.
Another industrial practice, like Splunk, recommends converting fields into key-value pairs in a single log line (logfmt). For example, the Nginx log as a canonical log line becomes:
remote-ip=10.209.21.28 remote-user=null datetime="04/Mar/2023:10:49:21 +0800" method=GET url=/index.html protocol=HTTP/1.1 status=200 size=1314 refer=https://guangzhengli.com agent="Mozilla/5.0 (Macintosh; Intel Mac OS X 10_15_7) AppleWebKit/537.36 (KHTML, like Gecko) Chrome/110.0.0.0 Safari/537.36"
Stored in Splunk, this data can be queried using built-in query language, like method=get status=500 to find all GET methods returning 500 responses. Using method=get status=500 earliest=-7d | timechart count to get the total number and chart of GET methods returning 500 responses in the past 7 days. For more details, refer to Stripe canonical-log-lines.
Log Storage and Query
After structuring logs, we can store and analyze them in a database. Before choosing a storage and analysis solution, let's look at log data characteristics:
- Logs are write-intensive, with over 99% not queried after writing.
- Logs are standard time-series data, written sequentially and not modified after storage.
- Logs are time-sensitive, usually only needing recent logs for query and analysis, with older logs cleared or archived.
- Logs are semi-structured, even if all application service logs are structured, system logs, network logs, etc., have different fields.
- Log queries rely on full-text search and ad-hoc search.
- Log queries don't require strong timeliness but can't accept hour or day delays.
Based on these needs, Elasticsearch excels in log storage. Elasticsearch can use time ranges as indexes, like daily indexes, avoiding dynamic creation overhead. It can handle hot and cold data, using SSDs and stronger processors for recent logs, and HDDs or AWS S3 for older logs.
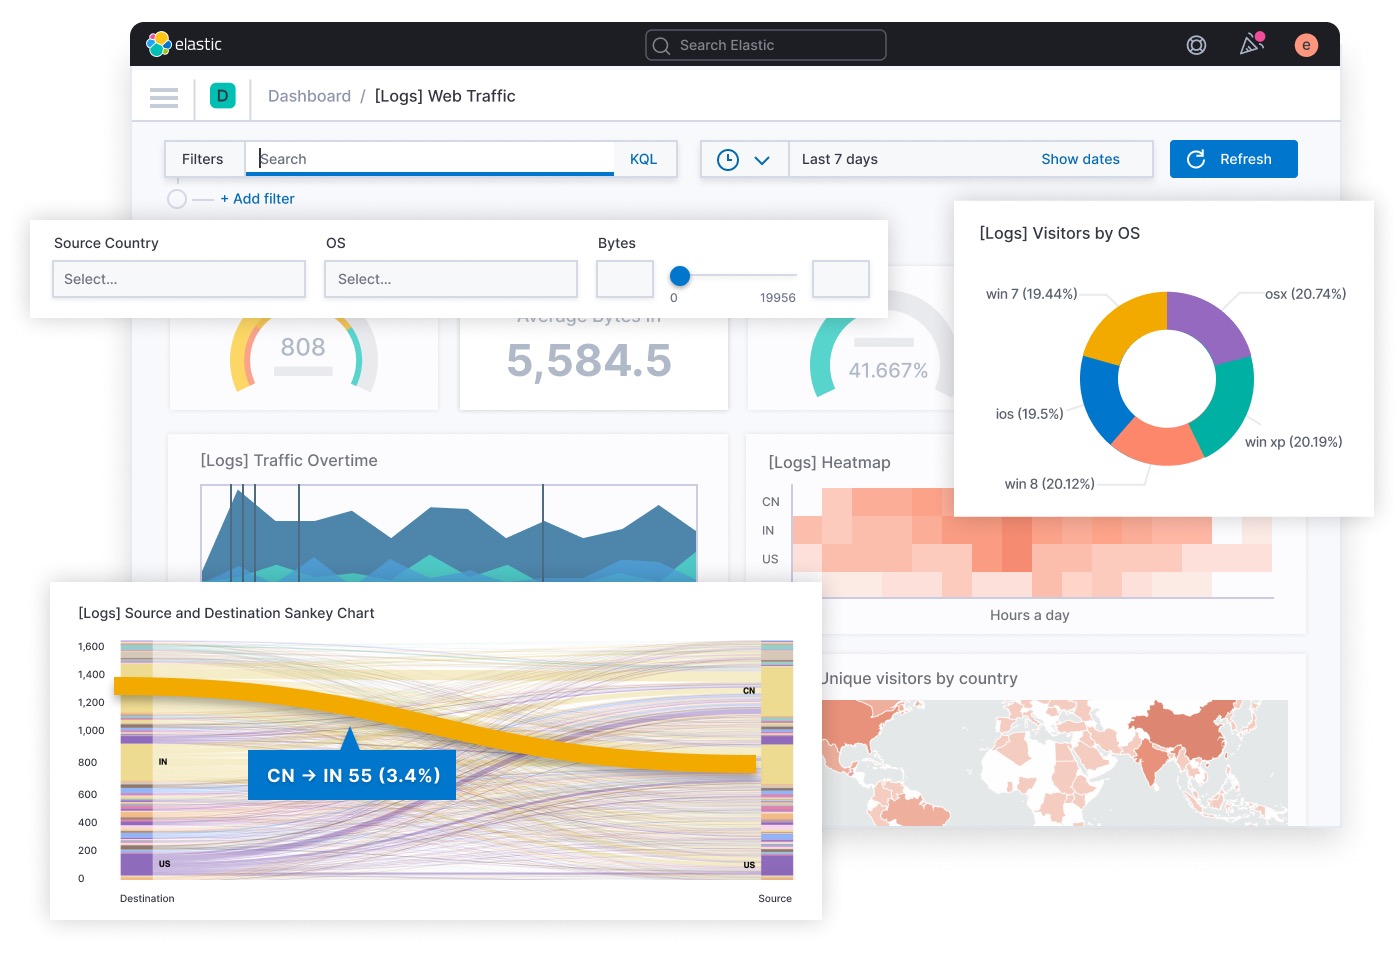
Most importantly, Elasticsearch's core storage engine uses inverted indexes, perfect for full-text search. Paired with Kibana (for graphical interface and display), it supports data search, aggregation, statistics, and custom charts and tables. Below is an official Elastic Stack image:

However, Elasticsearch has drawbacks, like Mapping Explosion, where too many keys in the mapping table consume memory and cause frequent garbage collection. Its hot-cold storage also has issues, as daily data moves from hot to cold storage, affecting cluster read-write performance.
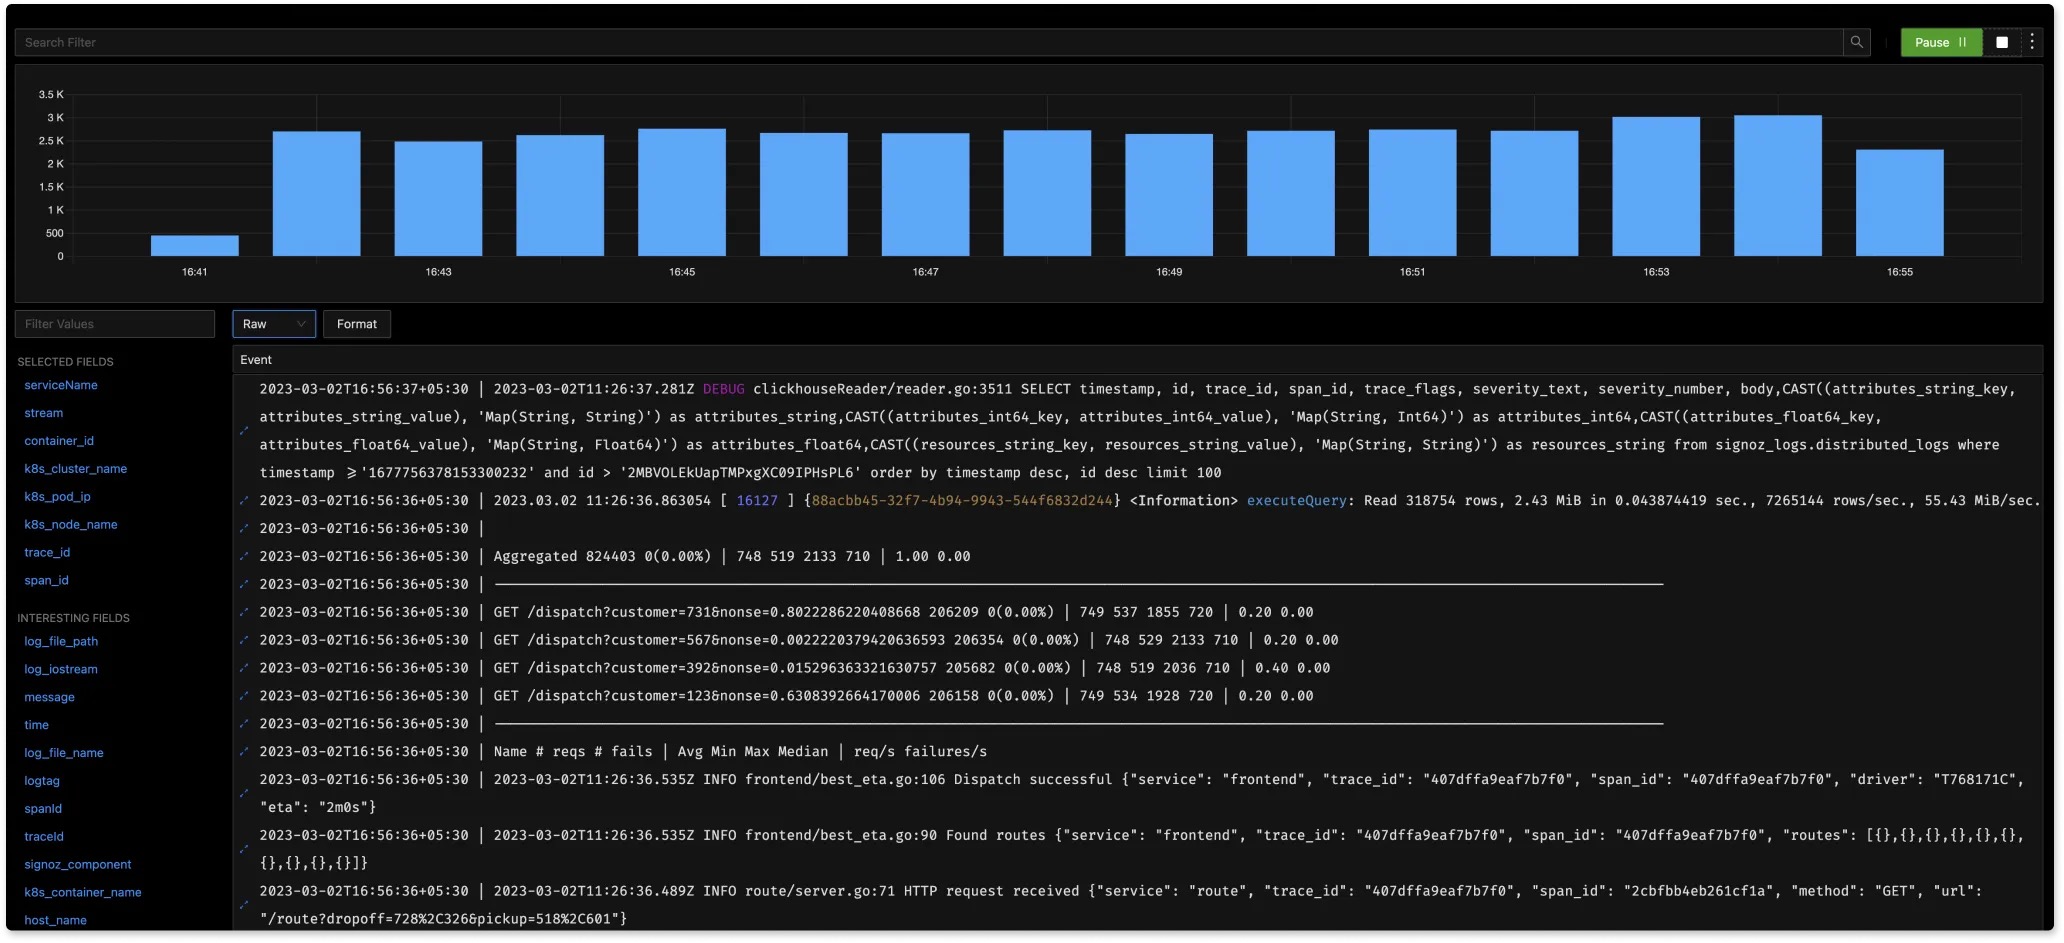
For medium-sized clusters and full-text search, Elasticsearch is excellent. For large clusters and analysis scenarios, columnar databases like ClickHouse may be better. Logs' immutability suits ClickHouse's storage and analysis capabilities, and its compression codecs can reduce storage needs. ClickHouse's linear scalability easily expands clusters. For more on using ClickHouse for logs, see Log analytics using ClickHouse. Commercial open-source company Signoz also uses ClickHouse for its OpenTelemetry implementation. Below is Signoz's real-time log analysis.

Conclusion
This article covers best practices for logging, challenges in log management, and solutions. Logs are crucial for system observability. As systems grow more complex, developers and operators should follow good logging practices to tackle log management challenges.
If there are any errors or biased views in the above content, please point them out directly. If you have additional information, feel free to comment or contribute to the repository. Thank you!
Reference
- https://blog.cloudflare.com/log-analytics-using-clickhouse/
- https://www.cortex.io/post/best-practices-for-logging-microservices
- https://stripe.com/blog/canonical-log-lines
- https://messagetemplates.org/
- https://www.dataset.com/blog/the-10-commandments-of-logging/
- https://brandur.org/canonical-log-lines
- https://dev.splunk.com/enterprise/docs/developapps/addsupport/logging/loggingbestpractices/
- https://opentelemetry.io/docs/reference/specification/logs/#log-correlation
- https://signoz.io/blog/opentelemetry-logs/
- https://izsk.me/2021/10/31/OpenTelemetry-Trace/
- https://sematext.com/guides/kubernetes-logging/
- https://www.datadoghq.com/product/log-management/
- https://www.dynatrace.com/monitoring/platform/log-management-analytics/
- https://tech.meituan.com/2017/02/17/change-log-level.html
- http://icyfenix.cn/distribution/observability/logging.html